import pandas as pd
import matplotlib.pyplot as plt
import numpy as np
import datetime
from datetime import timedelta
import seaborn as sns
sns.set(style="ticks", font_scale=1.5)
import matplotlib.gridspec as gridspec
from matplotlib.dates import DateFormatter
import matplotlib.dates as mdates
import matplotlib.ticker as ticker69 date formatting
Here you will find several examples of how to format dates in your plots. Not many explanations are provided.
How to use this page? Find first an example of a plot you like, only then go to the code and see how it’s done.
import pandas as pd

start_date = '2018-01-01'
end_date = '2018-04-30'

# create date range with 1-hour intervals
dates = pd.date_range(start_date, end_date, freq='1H')
# create a random variable to plot
var = np.random.rand(len(dates)) - 0.51
var = var.cumsum()
var = var - var.min()
# create dataframe, make "date" the index
df = pd.DataFrame({'date': dates, 'variable': var})
df.set_index(df['date'], inplace=True)
df| date | variable | |
|---|---|---|
| date | ||
| 2018-01-01 00:00:00 | 2018-01-01 00:00:00 | 28.317035 |
| 2018-01-01 01:00:00 | 2018-01-01 01:00:00 | 28.120523 |
| 2018-01-01 02:00:00 | 2018-01-01 02:00:00 | 28.596894 |
| 2018-01-01 03:00:00 | 2018-01-01 03:00:00 | 28.931941 |
| 2018-01-01 04:00:00 | 2018-01-01 04:00:00 | 28.561778 |
| ... | ... | ... |
| 2018-04-29 20:00:00 | 2018-04-29 20:00:00 | 1.914343 |
| 2018-04-29 21:00:00 | 2018-04-29 21:00:00 | 1.648757 |
| 2018-04-29 22:00:00 | 2018-04-29 22:00:00 | 1.992956 |
| 2018-04-29 23:00:00 | 2018-04-29 23:00:00 | 1.500860 |
| 2018-04-30 00:00:00 | 2018-04-30 00:00:00 | 1.650439 |
2857 rows × 2 columns
define a useful function to plot the graphs below
def explanation(ax, text, letter):
    ax.text(0.99, 0.97, text,
            transform=ax.transAxes,
            horizontalalignment='right', verticalalignment='top',
            fontweight="bold")
    ax.text(0.01, 0.01, letter,
            transform=ax.transAxes,
            horizontalalignment='left', verticalalignment='bottom',
            fontweight="bold")
    ax.set(ylabel="variable (units)")
    ax.spines['top'].set_visible(False)
    ax.spines['right'].set_visible(False)
fig, ax = plt.subplots(1, 1, figsize=(8, 6))
ax.plot(df['variable'])
plt.gcf().autofmt_xdate() # makes slated dates
explanation(ax, "slanted dates", "")
fig.savefig("dates1.png")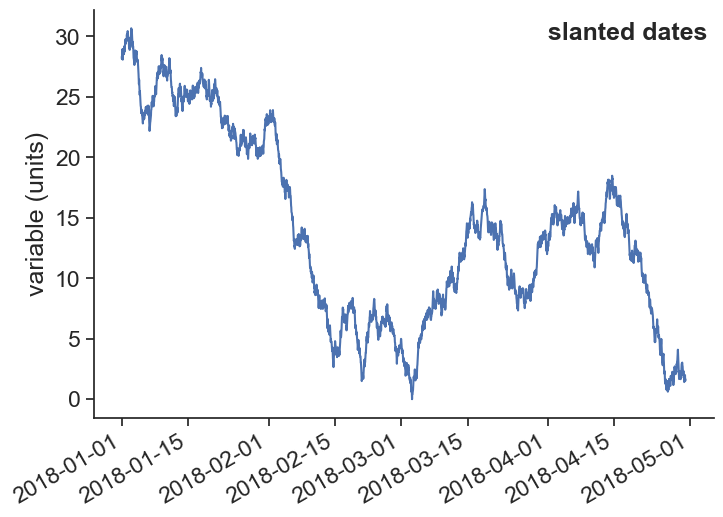
fig, ax = plt.subplots(4, 1, figsize=(10, 16),
                       gridspec_kw={'hspace': 0.3})

### plot a ###
ax[0].plot(df['variable'])
date_form = DateFormatter("%b")
ax[0].xaxis.set_major_locator(mdates.MonthLocator(interval=2))
ax[0].xaxis.set_major_formatter(date_form)

### plot b ###
ax[1].plot(df['variable'])
date_form = DateFormatter("%B")
ax[1].xaxis.set_major_locator(mdates.MonthLocator(interval=1))
ax[1].xaxis.set_major_formatter(date_form)

### plot c ###
ax[2].plot(df['variable'])
ax[2].xaxis.set_major_locator(mdates.MonthLocator())
# 16 is a slight approximation for the center, since months differ in number of days.
ax[2].xaxis.set_minor_locator(mdates.MonthLocator(bymonthday=16))
ax[2].xaxis.set_major_formatter(ticker.NullFormatter())
ax[2].xaxis.set_minor_formatter(DateFormatter('%B'))
for tick in ax[2].xaxis.get_minor_ticks():
    tick.tick1line.set_markersize(0)
    tick.tick2line.set_markersize(0)
    tick.label1.set_horizontalalignment('center')

### plot d ###
ax[3].plot(df['variable'])
date_form = DateFormatter("%d %b")
ax[3].xaxis.set_major_locator(mdates.DayLocator(interval=15))
ax[3].xaxis.set_major_formatter(date_form)

explanation(ax[0], "month abbreviations, every 2 months", "a")
explanation(ax[1], "full month names", "b")
explanation(ax[2], "full month names centered between the 1st of the month", "c")
explanation(ax[3], "day + month abbr. --- every 15 days", "d")

fig.savefig("dates2.png")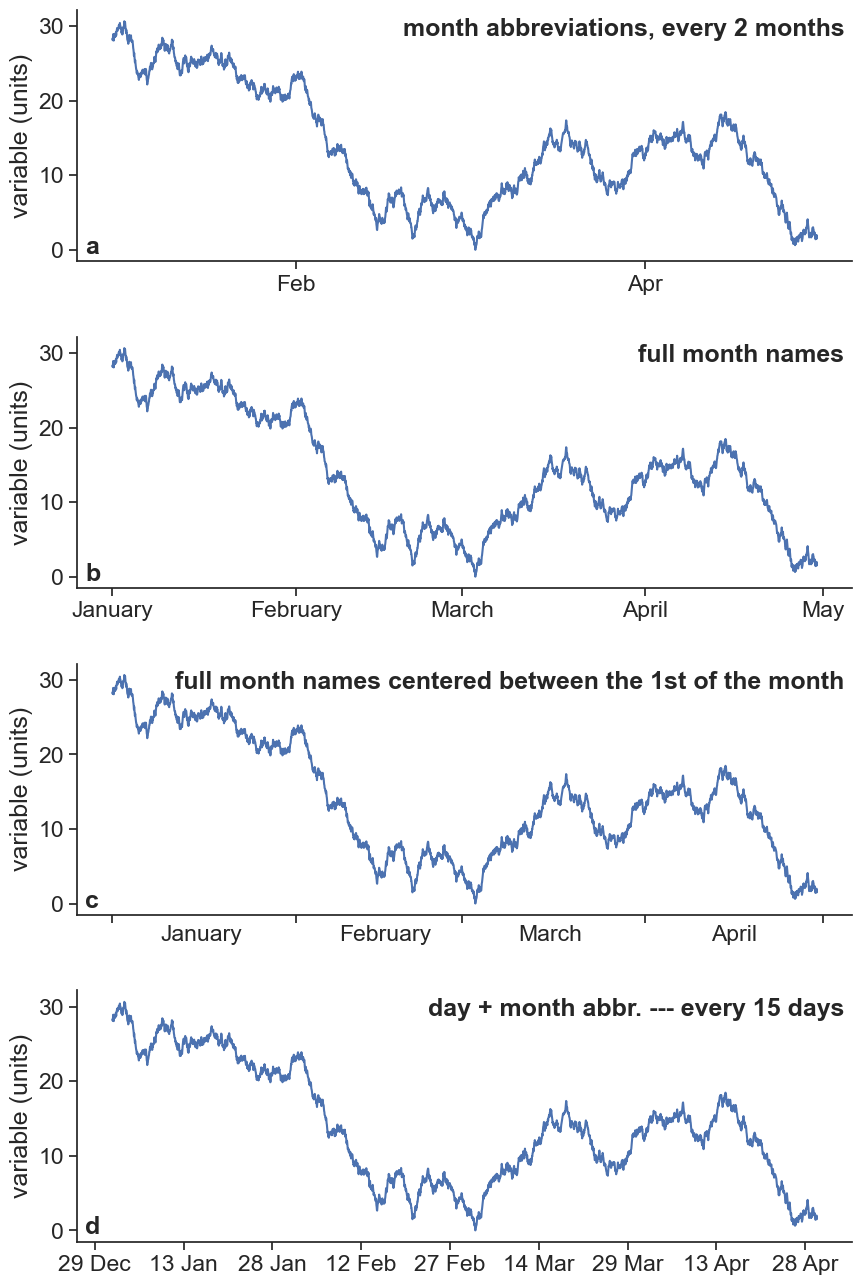
fig, ax = plt.subplots(4, 1, figsize=(10, 16),
                       gridspec_kw={'hspace': 0.3})

### plot e ###
ax[0].plot(df['variable'])
date_form = DateFormatter("%d/%m")
ax[0].xaxis.set_major_locator(mdates.DayLocator(bymonthday=[5, 20]))
ax[0].xaxis.set_major_formatter(date_form)

### plot f ###
ax[1].plot(df['variable'])
locator = mdates.AutoDateLocator(minticks=11, maxticks=17)
formatter = mdates.ConciseDateFormatter(locator)
ax[1].xaxis.set_major_locator(locator)
ax[1].xaxis.set_major_formatter(formatter)

### plot g ###
ax[2].plot(df.loc['2018-01-01':'2018-03-01', 'variable'])
locator = mdates.AutoDateLocator(minticks=6, maxticks=14)
formatter = mdates.ConciseDateFormatter(locator)
ax[2].xaxis.set_major_locator(locator)
ax[2].xaxis.set_major_formatter(formatter)

### plot h ###
ax[3].plot(df.loc['2018-01-01':'2018-01-02', 'variable'])
locator = mdates.AutoDateLocator(minticks=6, maxticks=10)
formatter = mdates.ConciseDateFormatter(locator)
ax[3].xaxis.set_major_locator(locator)
ax[3].xaxis.set_major_formatter(formatter)

explanation(ax[0], "exactly on days 05 and 20 of each month", "e")
explanation(ax[1], "ConciseDateFormatter", "f")
explanation(ax[2], "ConciseDateFormatter", "g")
explanation(ax[3], "ConciseDateFormatter", "h")

fig.savefig("dates3.png")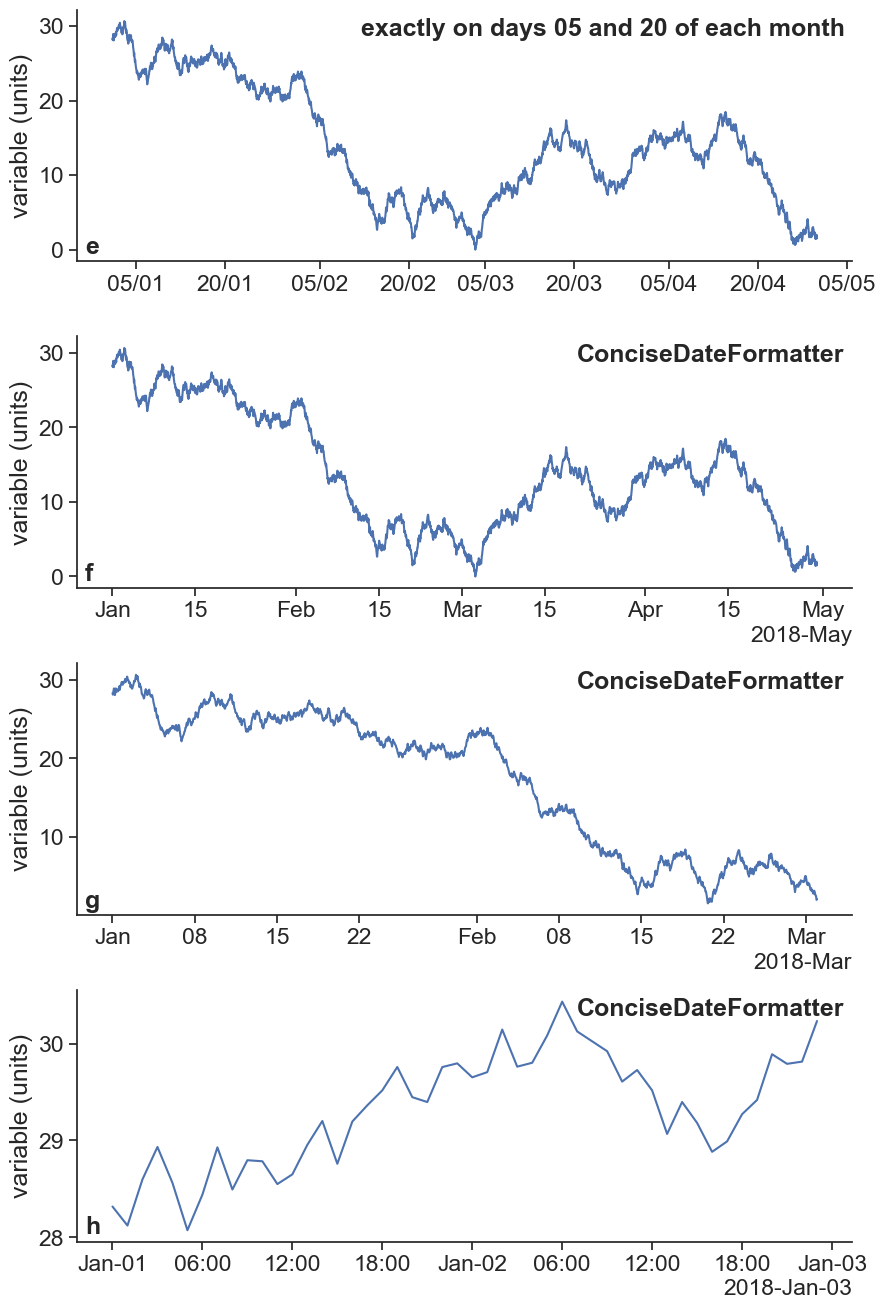
fig, ax = plt.subplots(1, 1, figsize=(10, 4),
                       gridspec_kw={'hspace': 0.3})

# import constants for the days of the week
from matplotlib.dates import MO, TU, WE, TH, FR, SA, SU
ax.plot(df['variable'])
# tick on sundays every third week
loc = mdates.WeekdayLocator(byweekday=SU, interval=3)
ax.xaxis.set_major_locator(loc)
date_form = DateFormatter("%a, %b %d")
ax.xaxis.set_major_formatter(date_form)
fig.autofmt_xdate(bottom=0.2, rotation=30, ha='right')
explanation(ax, "every 3 Sundays, rotate labels", "")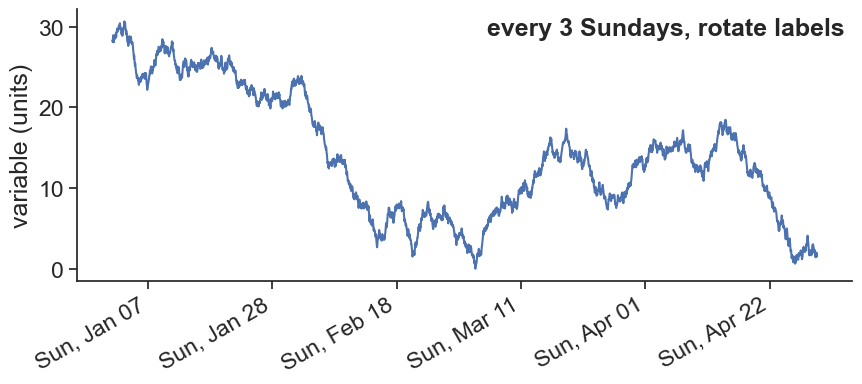
| Code | Explanation |
|---|---|
| %Y | 4-digit year (e.g., 2022) |
| %y | 2-digit year (e.g., 22) |
| %m | 2-digit month (e.g., 12) |
| %B | Full month name (e.g., December) |
| %b | Abbreviated month name (e.g., Dec) |
| %d | 2-digit day of the month (e.g., 09) |
| %A | Full weekday name (e.g., Tuesday) |
| %a | Abbreviated weekday name (e.g., Tue) |
| %H | 24-hour clock hour (e.g., 23) |
| %I | 12-hour clock hour (e.g., 11) |
| %M | 2-digit minute (e.g., 59) |
| %S | 2-digit second (e.g., 59) |
| %p | “AM” or “PM” |
| %Z | Time zone name |
| %z | Time zone offset from UTC (e.g., -0500) |