import numpy as npimport matplotlib.pyplot as pltimport matplotlib as mplimport pandas as pdfrom pandas.plotting import register_matplotlib_convertersregister_matplotlib_converters() # datetime converter for a matplotlibimport seaborn as snssns.set_theme(style="ticks", font_scale=1.5)import matplotlib.gridspec as gridspec
define functions for calculating DTW
def fill_dtw_cost_matrix(abs_diff): N1, N2 = abs_diff.shape cost_matrix = abs_diff.copy() # make a copy# prepend row full of nan cost_matrix = np.vstack([np.full(N1, np.nan), cost_matrix])# prepend col full of nan cost_matrix = np.hstack([np.full((N2+1,1), np.nan), cost_matrix])# make origin zero cost_matrix[0, 0] =0for i inrange(1, N1+1):for j inrange(1, N2+1): south = cost_matrix[i-1, j ] west = cost_matrix[i , j-1] southwest = cost_matrix[i-1, j-1]# print(([south, west, southwest]))# print(np.nanmin([south, west, southwest])) cost_matrix[i, j] = cost_matrix[i, j] + np.nanmin([south, west, southwest])return cost_matrixdef find_min_path(m): N1, N2 = m.shape path=[[N1-1, N2-1]] i,j = path[-1][0], path[-1][1]whileTrue: south = m[i-1, j] west = m[i, j-1] southwest = m[i-1, j-1]if southwest <=min(south, west): i = i-1 j = j-1elif south <= west: i = i-1else: j = j-1 path.append([i,j])if (i==1) & (j==1):breakreturn path
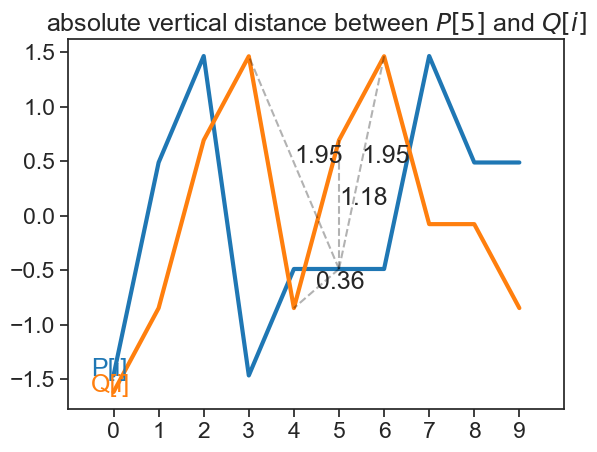
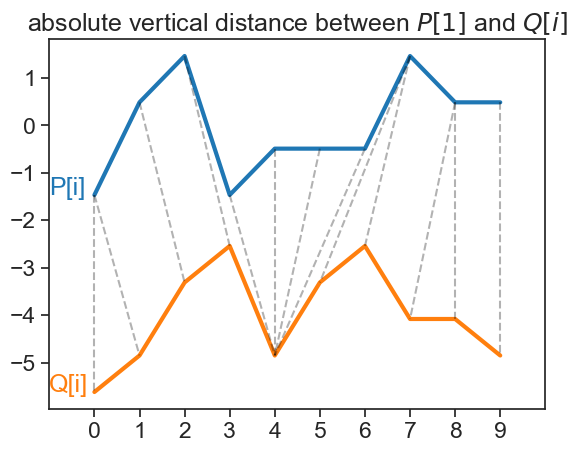
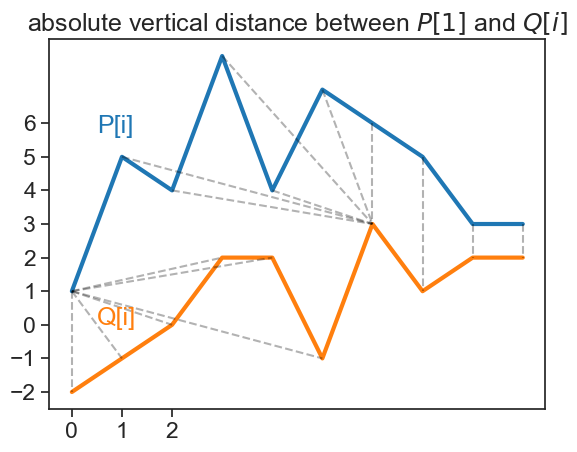
These are exactly the same series from before, with additional data points.
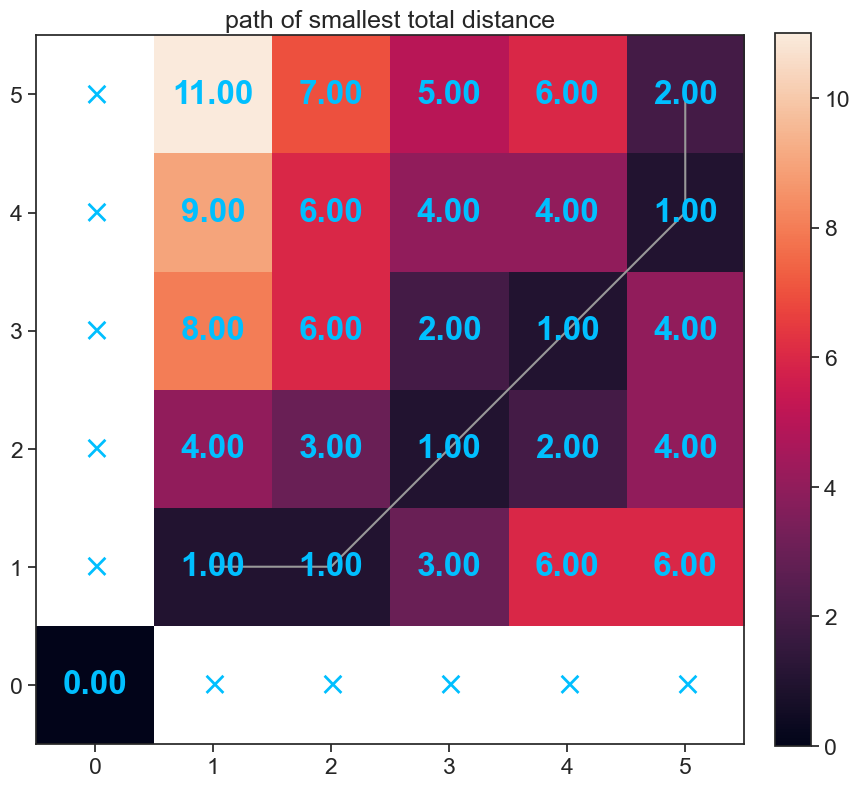
Let’s build the cost matrix and the best path
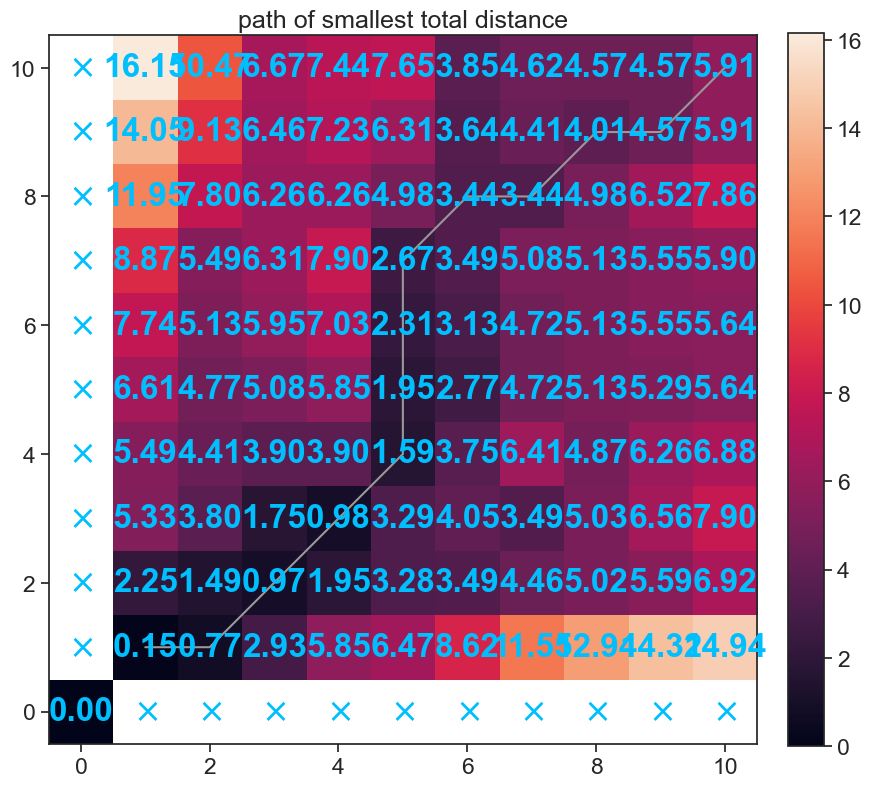
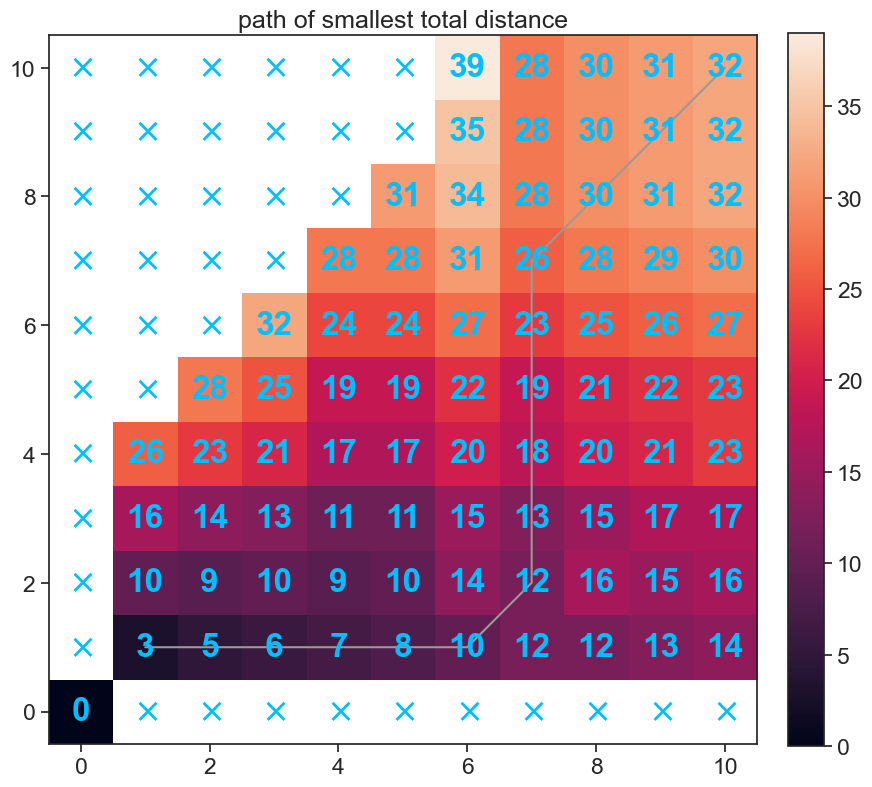
plot_cost_and_path(m_c, p_c)
Now the path meanders both above and below the diagonal, meaning that the second time series sometimes lags behind (bottom) and sometimes leads ahead (top) the first time series,