21 substituting outliers
Ok. We found the outliers. Now what?!
As usual, it depends.
21.1 Do nothing
Assuming the outlier indeed happened in real life, and is not the result of faulty data transmission or bad data recording, then excluding an outlier might be the last thing you want to do. Sometimes extreme events do happen, such as a one-in-a-hundred-year storm, and they have a disproportionate weight on the system you are studying. The outliers might actually be the most interesting points in your data for all you know!
In case the outliers are not of interest to you, if you are using robust methods to analyze your data, you don’t necessarily need to do anything either. For instance, let’s say that you want to smooth your time series. If instead of taking the mean inside a sliding window you choose to calculate the median, then outliers shouldn’t be a problem. Test it and see if it’s true. Go on.
For many things you need to do (not only smoothing), you might be able to find robust methods. What do you do if you have to use a non-robust method? Well, then you can substitute the outlier for two things: NaN or imputated values.
21.2 NaN
Substitute outliers for NaN.
NaN means “Not a Number”, and is what you get when you try to perform a mathematical operation like 0/0. It is common to see NaN in dataset rows when data was not collected for some reason.
This might seem like a neutral solution, but it actually can generate problems down the line. See this example:
# example using numpy
series = np.array([2, 4, 5, np.nan, 8, 15])
mean = np.mean(series)
print(f"the series average is {mean}")
the series average is nanA single NaN in your time series ruins the whole calculation! There is a workaround though:
You have to make sure what is the behavior of each function you use with respect to NaNs, and if possible, use a suitable substitute.
The same example in pandas would not fail:
21.3 imputate values
To “imputate values” means to fill in the missing value with a guess, an estimation of what this data point “should have been” if it were measured in the first place. Why should we bother to do so? Because many tools that we know and love don’t do well with missing values.
We learned about the Savitzky-Golay filter for smoothing data. See what happens when there is a single NaN in the series:
smooth it and then plot
df['sg'] = savgol_filter(df['series'], window_length=15, polyorder=2)

def concise(ax):
    locator = mdates.AutoDateLocator(minticks=3, maxticks=7)
    formatter = mdates.ConciseDateFormatter(locator)
    ax.xaxis.set_major_locator(locator)
    ax.xaxis.set_major_formatter(formatter)

fig, ax = plt.subplots(figsize=(8,4))
ax.plot(df['series'], color="tab:blue", label="series with 1 NaN")
ax.plot(df['sg'], color="tab:orange", label="SavGol filter has many more NaNs")
concise(ax)
ax.legend(frameon=False);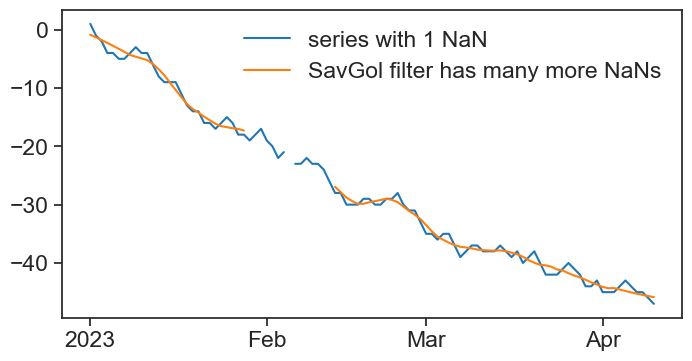
We will deal with this topic in the next chapter, “interpolation”. There, we will learn a few methods to fill in missing data, and basic NaN operations you should be acquainted with.