A tool is said to be robust if outliers don’t influence (much) its results.
The average and standard deviation are not robust.
import numpy as np= np.array([0 , 1 , 2 , 3 , 4 , 5 , 6 ])= np.array([0 , 1 , 2 , 3 , 4 , 5 , 60 ])print (f"series 1: mean= { series1. mean():.2f} , std= { series1. std():.2f} " )print (f"series 2: mean= { series2. mean():.2f} , std= { series2. std():.2f} " )
series 1: mean=3.00, std=2.00
series 2: mean=10.71, std=20.18
On the other hand, the median and IQR are robust:
from scipy.stats import iqrprint (f"series 1: median= { np. median(series1):.2f} , IQR= { iqr(series1):.2f} " )print (f"series 2: median= { np. median(series2):.2f} , IQR= { iqr(series2):.2f} " )
series 1: median=3.00, IQR=3.00
series 2: median=3.00, IQR=3.00
MAD
Another rubust method is MAD, the Median Absolute Deviation, given by
\text{MAD} = \text{median}(\left| x_i - \text{median}(x) \right|),
where |\cdot| is the absolute value.
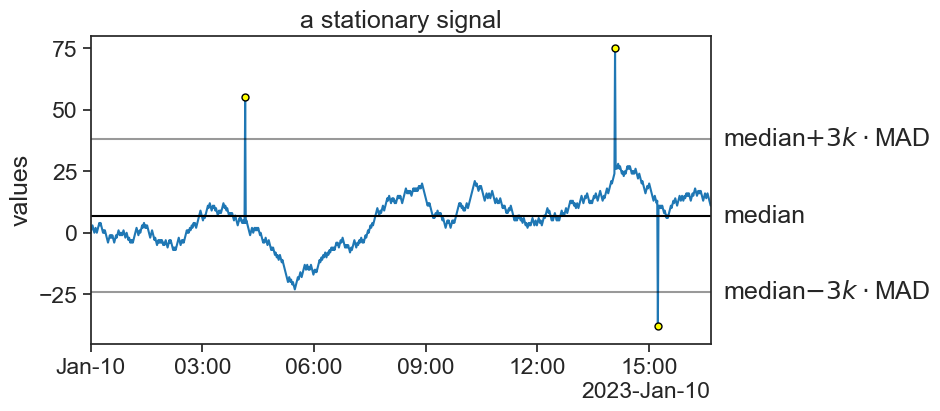
Applying MAD to the stationary time series from before, yields
Here, the threshold is the median \pm3k\cdot MAD, where the value k=1.4826 scales MAD so that when the data is gaussianly distributed, 3k equals 1 standard deviation.