49 practice 2
In this practice we will find the frequency of an interesting oscillation in transpiration measured from a grapevine leaf using a LICOR 6400. We thank Yotam Zait for providing us this interesting measurement.
| E | |
|---|---|
| date | |
| 2023-07-10 10:37:30 | 0.004116 |
| 2023-07-10 10:38:30 | 0.004012 |
| 2023-07-10 10:39:30 | 0.003694 |
| 2023-07-10 10:40:30 | 0.003506 |
| 2023-07-10 10:41:30 | 0.003361 |
| ... | ... |
| 2023-07-13 20:14:23 | 0.000059 |
| 2023-07-13 20:15:23 | 0.000069 |
| 2023-07-13 20:16:23 | 0.000061 |
| 2023-07-13 20:17:23 | 0.000063 |
| 2023-07-13 20:18:23 | 0.000061 |
4886 rows × 1 columns
fig, ax = plt.subplots()
df['E'].loc[df['E']<4.5e-5] = np.nan
df['E'].ffill(inplace=True)
df['E'].plot()
ax.set(ylabel="transpiration")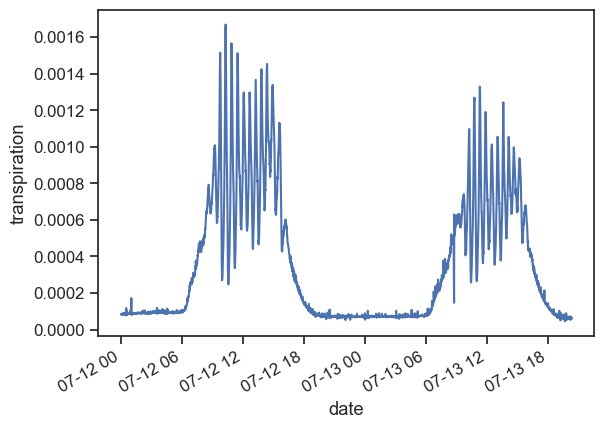
The measurements shown above suggest that there is a clear oscillatory pattern in the grapevine transpiration. Zooming in, we see that the oscillation period is about once every half hour. Let’s find out exactly what the period is.
N = len(df)
F = scipy.fft.fft(df['E'].values) / N
n = np.arange(N)
# the basic time unit here is "second"
# measurements every 60 seconds
dt = 60  # seconds
freq = scipy.fft.fftfreq(N, d=dt)

# Get the one-sided spectrum
n_oneside = N//2
# get the one side frequency
k_oneside = freq[:n_oneside]
F_oneside = F[:n_oneside]
fig, ax = plt.subplots()
ax.plot(k_oneside, np.abs(F_oneside))
ax.set(xlabel='freq (Hz)',
       ylabel='|F(freq)|')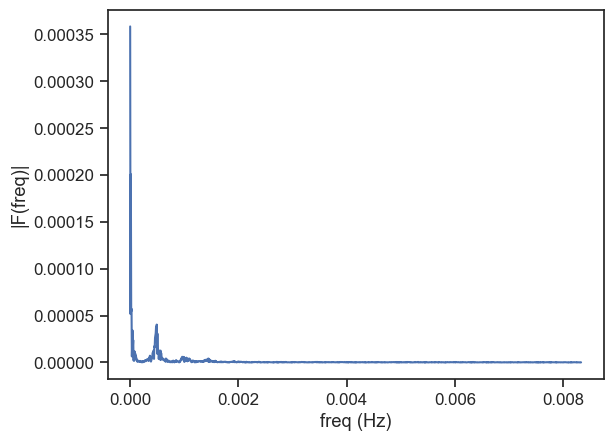
The first peak corresponds to very low frequencies (day), and the second peak is probably what we need. Let’s focus on that.
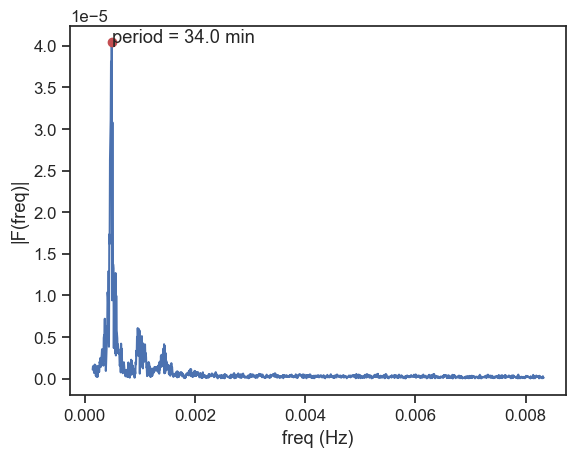
# ignore periods longer then 120 min
cutoff = 1 / (120*60)
mask = np.where(k_oneside > cutoff)
k_oneside = k_oneside[mask]
F_oneside = F_oneside[mask]

index_max = np.argmax(np.abs(F_oneside))
k_max = k_oneside[index_max]
F_max = np.abs(F_oneside[index_max])
period = 1 / k_max

fig, ax = plt.subplots()
ax.plot(k_oneside, np.abs(F_oneside))
ax.plot([k_max], [F_max], 'ro')
ax.text(k_max, F_max, f"period = {period / 60:.1f} min")
ax.set(xlabel='freq (Hz)',
       ylabel='|F(freq)|')